Introduction
When training AI models or rendering simulations, nothing is more frustrating than slowdowns, out-of-memory errors, or mysterious crashes that leave you guessing. To launch confidently, especially on rented GPU hardware, you need visibility into what’s happening under the hood—in real time and across your session history.
This is where SimplePod.ai really shines. Beyond offering affordable, on-demand GPU rentals, SimplePod equips you with built-in tools that allow you to monitor utilization, memory, and system performance—all from a clean, intuitive dashboard. Whether you’re an ML hobbyist, researcher, or solo developer, having this level of control can mean the difference between hitting your stride and getting stuck guessing.
In this article, we’ll dive deep into how SimplePod’s monitoring features work, why they matter, and how you can leverage them to optimize workflows, control costs, and remain in full command of your GPU sessions.
1. Why Real-Time Monitoring Matters in AI/ML Workflows
Before exploring the tools, let’s talk about why monitoring matters for anyone working with GPU-intensive workloads:
- Optimize Performance — Knowing how much GPU and VRAM you’re using helps pinpoint bottlenecks and fine-tune batch sizes, model depth, or data throughput
- Save Costs — Cloud GPU usage often comes with time-based billing. Underutilizing GPU time means wasted money. Real-time visibility helps you shut down idle sessions promptly or adjust usage dynamically
- Prevent Failures — Memory leaks, overheating, or unbalanced workloads are easier to detect before they crash your job—especially crucial during long runs.
- Maintain Workflow Flow — Being able to glance at what’s happening and adjust on the fly keeps you in the “flow state” of code-experiment-iterate.
2. SimplePod.ai’s Dashboard: What You Can Monitor
SimplePod.ai simplifies all this via a sleek web interface. Key features include:
- Real-time tracking of GPU utilization, VRAM usage, system memory, and more—right in your browser
- Server logs accessible from the same panel, helping trace errors or debug issues with visibility into system output.
- Batch command execution, allowing you to run scripts or maintenance commands across multiple sessions from a centralized console
- Web console and Jupyter access, letting you manage files, processes, and workflows, or dive straight into experimentation life via inline notebooks
This unified experience—monitoring, control, development tools—all in one UI, shifts your focus from juggling tools to actual model building.
3. From Setup to Monitoring: Step-by-Step Workflow
Here’s how a typical SimplePod AI/ML workflow looks:
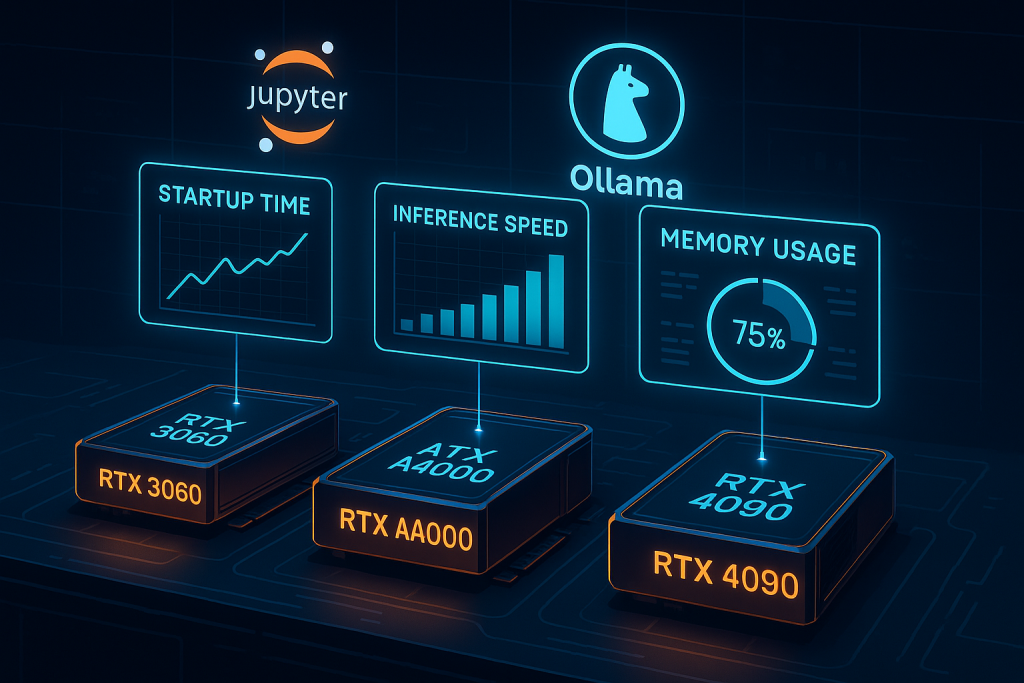
- Choose your GPU — e.g. RTX 3060, RTX 4090, etc.
- Select your environment — TensorFlow, PyTorch, Jupyter, etc.
- Launch the instance and wait a few minutes for it to spin up.
- Navigate to the dashboard where real-time metrics appear instantly—GPU usage, VRAM consumption, system stats.
- Start your tasks — trigger training, data processing, or model runs.
- Monitor your resource use and check logs as needed.
- Send batch commands or switch to Jupyter for interactive work.
- Terminate the instance when done to avoid extra costs.
This workflow ensures you’re always plugged into what’s happening—not dropping into SSH tunnels or third-party tools just to check a graph.
4. Understanding Key Metrics
Here’s what to pay attention to and why:
- GPU Utilization — See if your model is fully using compute. Low utilization may mean I/O bottlenecks or inefficient code.
- VRAM Usage — Crucial indicator for memory-heavy models like large transformers. You want enough, but not wasted RAM.
- System Memory — Useful when data loading, caching, or CPU-side operations are part of your workflows.
- Server Logs — Show GPU driver issues, CUDA errors, Python exceptions—you can catch them early instead of post-mortem.
Armed with these metrics, you gain insight into what’s working—and what’s not—mid-run.
5. Use Cases: How Monitoring Improves Efficiency
** Experimentation Phase**
You’re tweaking hyperparameters or debugging a new model. Dashboard visibility lets you:
- Check if VRAM is maxed out (time to drop batch size or switch to FP16).
- Observe GPU usage—if it barely dips into double digits, perhaps data loading is the bottleneck.
** Long Training Runs**
Need to run overnight? Keep an eye on:
- Real-time GPU usage to see if the job’s still active.
- Logs, so you can spot silent failures or driver crashes in progress.
** Cost-Conscious Development**
You’re renting a GPU by the hour. Use dashboard to:
- Spot idle time quickly and shut down.
- Optimize workload to maintain high utilization—so your money buys results.
6. Advanced: Historical Metrics & Usage Insights
While SimplePod offers real-time visuals, historical data—either within your session or across uses—is invaluable for:
- Trend analysis — spot patterns in usage over multiple sessions.
- Performance improvement — check if changes resulted in better utilization.
- Cost forecasting — estimate hours needed and plan budget accordingly.
SimplePod currently focuses on real-time monitoring, but you can supplement it with tools like Prometheus + Grafana, DCGM-Exporter, or Python wrappers like gpu_tracker for long-term tracking
7. Community Insights: Practical Monitoring Tips
From real user discussions (via Reddit), here are some useful points echoed by AI/ML practitioners:
“I built this tiny tool to help… shutdown the instance if GPU usage drops under 30% for 5 minutes.” — a handy way to cut wasted costs on idle instances
“nvtop is better than nvidia-smi. It shows memory and CPUs usage.” – some prefer nvtop for local monitoring, it’s more visual and richer in info
While not specific to SimplePod, combining Grafana with Prometheus is a popular approach for building detailed dashboards—great if you add historical tracking layers
8. What’s Next: Enhanced Monitoring Possibilities
Want even more depth? Here are some powerful paths:
- Integrate DCGM-Exporter → Prometheus → Grafana for detailed dashboards, historical views, and alerts (e.g., GPU temperature thresholds, memory saturation)
- Use Python wrappers like gpu_tracker to log resource peaks and runtime behavior for further analysis
- Create automated shutdown scripts, e.g., using thresholds on utilization—some users already do it manually or via lightweight tools.
Combining SimplePod’s inbuilt features with DIY enhancements gives you powerful control over your runtime environment—both now and historically.
Conclusion
For AI/ML enthusiasts, the ability to observe GPU and system behavior in real time transforms how you develop models and manage sessions. SimplePod.ai gives you clean, visual access to core metrics—GPU usage, VRAM, memory, logs, and command execution—all directly in its dashboard. That clarity translates into better resource use, higher productivity, and smarter spending.
When paired with optional tools for historical logging, alerts, and dashboards, SimplePod becomes not just a rental service—but a performance-driven workspace. You can code, iterate, and optimize without ever losing sight of what your GPU is doing—or costing.
Take control. Monitor actively. Optimize confidently. That’s the SimplePod advantage.